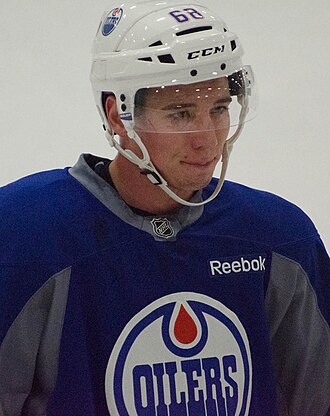
Photo by Connor Mah, CC BY-SA 3.0

Tyler Pitlick
Minnesota Wild Center #19
11 years and 450 games of fourth-line minutes, now down to under 8 a night.
| Season | Team | GP | G | A | PTS | +/- | PIM | PP | SH | GW | S | S% | TOI |
|---|---|---|---|---|---|---|---|---|---|---|---|---|---|
| 2013-14 | EDM | 10 | 1 | 0 | 1 | -2 | 0 | 0 | 0 | 0 | 9 | 11.1 | 8:58 |
| 2014-15 | EDM | 17 | 2 | 0 | 2 | -3 | 4 | 0 | 0 | 1 | 18 | 11.1 | 12:27 |
| 2016-17 | EDM | 31 | 8 | 3 | 11 | 0 | 6 | 0 | 0 | 1 | 54 | 14.8 | 9:55 |
| 2017-18 | DAL | 80 | 14 | 13 | 27 | +9 | 34 | 0 | 0 | 2 | 129 | 10.8 | 13:41 |
| 2018-19 | DAL | 47 | 8 | 4 | 12 | -2 | 6 | 1 | 0 | 1 | 75 | 10.7 | 13:23 |
| 2019-20 | PHI | 63 | 8 | 12 | 20 | +11 | 12 | 0 | 0 | 1 | 76 | 10.5 | 12:03 |
| 2020-21 | ARI | 38 | 6 | 5 | 11 | -1 | 16 | 0 | 1 | 0 | 56 | 10.7 | 16:22 |
| 2021-22 | CGY/MTL | 39 | 1 | 4 | 5 | -11 | 6 | 0 | 0 | 0 | 36 | 2.8 | 10:56 |
| 2022-23 | STL | 61 | 7 | 9 | 16 | -1 | 14 | 0 | 0 | 0 | 54 | 13.0 | 10:05 |
| 2023-24 | NYR | 34 | 1 | 3 | 4 | -6 | 4 | 0 | 0 | 0 | 32 | 3.1 | 10:12 |
| 2025-26 | MIN | 32 | 2 | 0 | 2 | -4 | 24 | 0 | 0 | 0 | 26 | 7.7 | 7:46 |
| 2026-27 so far | — | — | — | — | — | — | — | — | — | — | — | — | — |
| Career | — | 452 | 58 | 53 | 111 | -10 | 126 | 1 | 1 | 6 | 565 | 10.3 | 11:50 |
This Season So Far
The 2026-27 season has not started. The empty row above is his, and both it and this paragraph fill in on their own from the morning after he first plays: what he has done, what it is worth against his own last season, and the run he is on when the two disagree.
Last Season
2 goals and no assists in 32 games on 7 and 3-quarter minutes a night. 2 points in a season is a hard line to read as anything but the end of a role.
The Finesse Game
Never his strength and now essentially absent. 58 goals in 452 career games. He shoots from close range when a puck finds him and does not otherwise participate in the offence.
The Physical Game
6-2 and 199, and the forechecking and the willingness are what have kept him employed. He finishes checks, goes to the net, and does the unrewarded work on a fourth line.
He has had a long history of injuries, which is part of why the games played have never been high.
The Intangibles
A second-round pick who became a career depth forward and lasted more than a decade at it, which almost nobody does by accident.
He is 34 and playing under 8 minutes a night. The next step down from this role is out of the league, and there is nothing in last season’s numbers to argue against it.
The numbers underneath
On the ice
Five-on-five, 2025-26 · 247 minutes
- Expected goals
- 43.6%
- 9th pct
- Shot attempts
- 40.3%
- 1st pct
share of the chances while he was out there
share of the attempts while he was out there
Goals while he was on the ice: 4 for, 9 against. Expected: 7.8 and 10.1.
The eye and the numbers
SightedThe report ranks him 24 points above where the numbers do. It was written with these numbers on screen and departs from them anyway, which makes the gap a judgment rather than an oversight. Why the numbers land there sets out the club he did it on, the minutes he played and the men he played them with.
Both bars are percentiles among the 656 skaters in this edition with a report and enough ice time. The report bar ranks the mean of the grades above — 69 on their own scale — against every other report's mean. The numbers bar ranks his share of expected goals. A gap is a disagreement about where he belongs, not two scales talking past each other.
Tracked
NHL Edge, 2025-26 · 32 games
- Top speed
- 22.3 mph
- 52nd pct
- Bursts over 20 mph
- 1.25 a game
- Distance
- 1.34 miles a game
- Hardest shot
- 80.7 mph
- 23rd pct
fastest he was clocked all season; the league's average best is 22.2
how often he reaches that speed, not how fast he goes
skated, all strengths
one shot; the league's average best is 83.6
A top speed is a season's best, and a man who takes more shifts gets more tries at one; the percentile is the feed's own, against every skater, and says less between a top-pair defenceman and a fourth-line wing than it does between two men in the same job. The counts are shown per game for the same reason.
Recent form
Last 17 appearances, 2025-26, oldest first
2
points in his last 10 games — 2 goals, 0 assists, 17 shots
Each bar is one game by points. Filled bars are games he scored in.
Usual linemates
2025-26 · 247 minutes at five-on-five
- Nico Sturm37%
- Yakov Trenin35%
Share of his five-on-five ice time spent alongside each player, measured from shift charts. Special teams are excluded: a power-play unit is not a line.
Why the numbers land there
Five-on-five, 2025-26
- The club
- MIN took 50.5% of the expected goals as a club. His own share is 43.6% — 6.9 below the club he did it on.
- The role
- 247 minutes at five-on-five — 3rd percentile in ice time.
With and without
| Teammate | Together | Him apart | Mate apart |
|---|---|---|---|
| Ben Jones | 42.8% | 44.6% | 38.1% |
| Nico Sturm | 55.2% | 36.2% | 44.9% |
| Yakov Trenin | 43.5% | 43.7% | 49.4% |
42.8% together, 44.6% for him apart and 38.1% for Jones apart. Jones was worse away from him while his own share held — the pairing was doing more for Jones than for him.
Expected-goal share while both were on the ice, and for each man in the minutes he played without the other. Apart is the pair subtracted from his own totals. It does not settle who was carrying whom — apart from each other, both were still playing with somebody — but it does say whether the share travelled when the pairing broke up.
Where he shoots from
goal on goal missed
38 unblocked shots in 2025-26, 2 of them goals. His median goal came from 13 feet. 39% of his shots came from inside twenty feet, 18% from beyond forty.